
Unboxing Hydroxyl Groups with Infrared Spectroscopy
Infrared spectroscopy is routinely used for identification of materials, whether known or unknown. Additionally, this technique provides other detailed insights into the environment of the material under investigation. The speed, accuracy and convenience of IR spectroscopy has made it a key technology in the contemporary analytical laboratory. Learn more as we discover the effect of intermolecular forces on the spectral features of the hydroxyl functional group.
Interpreting an IR Spectrum
Measured spectral bands are the result of vibration of covalent bonds within the material. Identity of the bonds and functional groups is determined by the position of the peak or collection of peaks. As a result, an infrared spectrum may be considered a “chemical fingerprint” which allows researchers to identify chemical and biochemical components in a sample.
Analyzing Hydroxyl Groups
Some functional groups, such as the hydroxyl (-OH) group, have an ability or tendency to interact with the surrounding environment and with each other. This -OH functional group can undergo hydrogen bonding, where the oxygen atom “pulls” electrons towards itself, forming a dipole, with the oxygen having a higher concentration of negative charge, and the hydrogen having a lower concentration of negative charge.
Interaction can occur with neighboring hydroxyl groups or water molecules when the more-positive hydrogen is attracted to the more-negative oxygen atom on the neighboring group or molecule. This “pull” affects the vibrational frequency of the bond, as well as the distribution of vibrational states as the interaction can form longer-reaching networks in condensed phases. This figure below shows infrared spectral measurements of 4-ethylphenol, an organic molecule with an OH group protruding from a six-member aromatic ring.
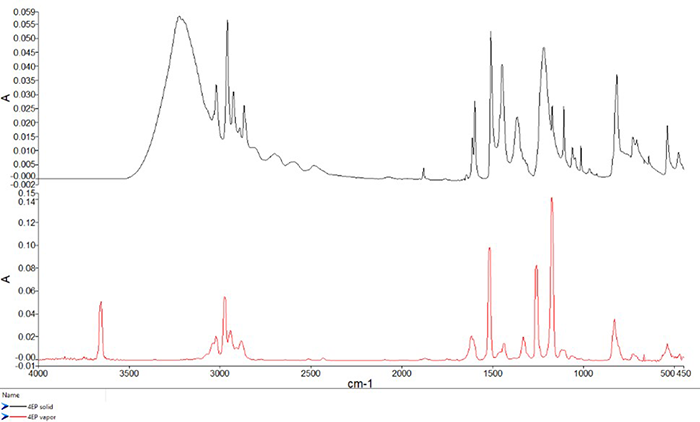
The top spectrum, shown in black, is an ATR measurement of the solid material, while the bottom spectrum, shown in red, is a spectrum of the same material in the vapor phase.
Can you spot the band associated with the OH stretch in this ATR measurement? If you guessed ~3225 cm-1, you were right.
In the solid phase, the OH groups form hydrogen bonds with each other, resulting in a very broad spectral band. It is worth noting that some of the width or “tailing” to the spectral bands most notable in the fingerprint region are caused by the refractive index. Now, can you spot the band from the OH stretch in the red vapor phase spectrum? The peak has changed remarkably in width and position, as it is now located near 3655 cm-1, shifted by approximately 440 cm-1, and full width at half maximum decreasing from about 233 to 18 cm-1. These changes occur because the 4-ethylphenol molecule is well-separated from other molecules in the vapor phase, so there is no hydrogen bonding taking place.
Conclusion
As new chemicals, biochemicals, and materials are developed, these advancements often bring new and complex analytical challenges. Therefore, it is imperative to utilize industry experts for solutions to these complex analytical challenges.
Whether you are investigating material composition or developing an understanding of its interaction with its surroundings, PerkinElmer has a wide range of FT-IR solutions to accelerate your analysis.