One NIR Animal Feed Calibration to Rule Them All
Feed producers often manufacture various products with different recipes for a range of animal species. Traditionally, multiple product-specific, near-infrared (NIR) calibrations have been used to predict the protein contents of the feed pellets. Although the recipes vary, there are similarities between the products meaning it would be possible and more practical to develop a few powerful global calibrations instead of many small, local calibrations.
While having a global calibration simplifies the calibration management and maintenance, it often requires more powerful regression techniques in order to account for the additional between-product variations.
The applications and the spectra also change over time due to sampling differences, instrumental aging, sample differences, different sample presentations, and different crop years. To adapt to new conditions, calibrations need to be updated, and that procedure should ideally be straightforward and effective.
We evaluated three different global calibration techniques for accuracy and adaptability:
Calibration methods
The regression techniques:
- Partial Least Squares Regression (PLS): a standard tool for NIR calibrations that is useful for regular linear calibration problems.
- Least-Squares Support Vector Machine Regression (LS-SVM): a powerful non-linear regression technique for complex applications.
- Honigs Regression (HR): tailored to cope with between-product variations (e.g,. clusters), each unknown spectra is compared to and corrected with respect to a library of samples.
Samples and NIR data
Monogastric (one stomach) feed is intended for pigs and poultry, and ruminant feed is for cattle and horses. A total of 10,815 unique monogastric and ruminant feed samples were collected from more than 40 different feed producers located in more than 15 countries over more than 10 years. The data comprise NIR measurements on different sizes and types of pellets. The protein levels were determined at various local laboratories using different laboratory methods and reported on an ‘as is’ moisture basis.
The spectra of these samples were measured using PerkinElmer spectrometers models DA 7250 and those in the DA 7300-family. These photo diode array spectrometers record the spectra in diffuse reflectance over the wavelength range of 950–1650 nm.
Procedure
The 10,815 sample spectra were divided into four separate groups: one set of ruminant feed samples (n = 2343) to train the initial calibrations; one set of monogastric feed samples to update the calibrations (n = 5274); and two sets of dedicated samples to validate the calibrations (ruminant n = 788), and monogastric (n = 2410) to:
- Develop calibrations for protein in ruminant feed on an ‘as is’ basis using the calibration samples.
- Update the calibrations with a few monogastric samples. The PLS and LS-SVM calibrations are recalculated without changing the number of PLS factors or the LS-SVM tuning parameters. For HR, the new samples are added to the library, but the calibration is not recalculated (the regression vector is fixed).
- Estimate the performance using the validation samples.
- Repeat points 2–3 until all monogastric update samples are added to the calibrations.
All calculations were made in Matlab environment using in-house code, the Statistics Toolbox, the LS-SVMlab Toolbox, and the PLS_Toolbox.
Results
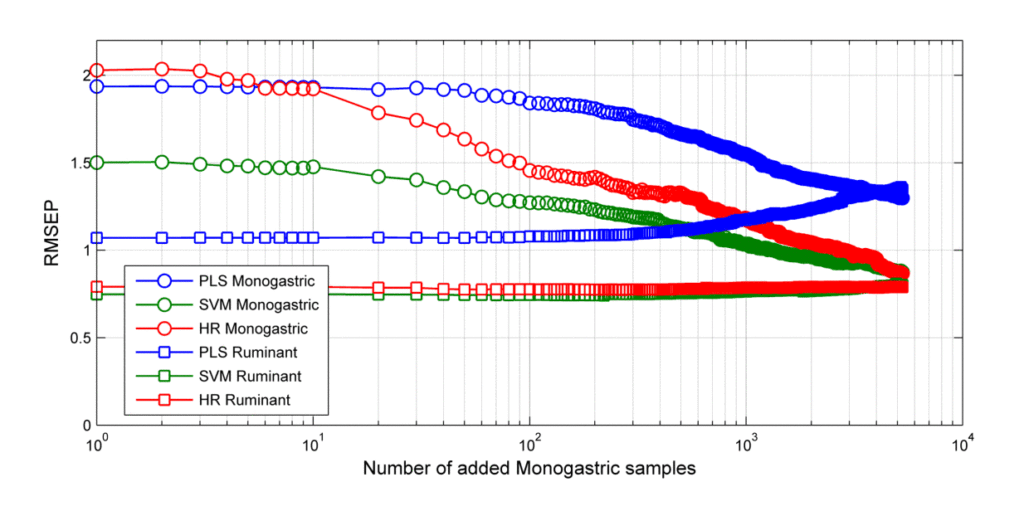
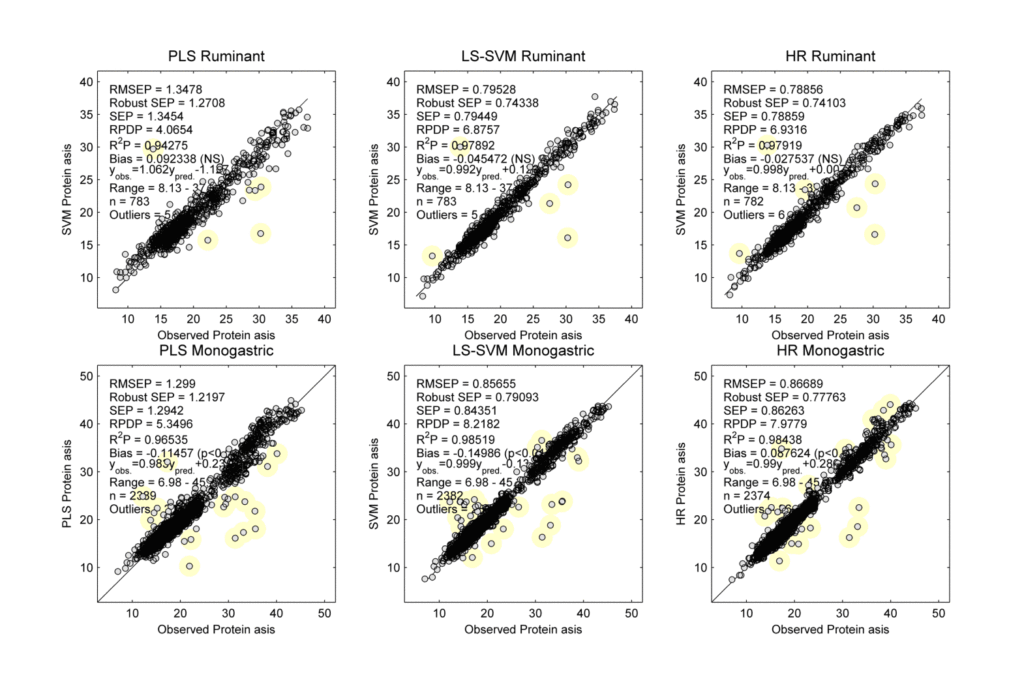
The root mean square error of prediction (RMSEP) values for the monogastric and ruminant validation samples as a function of the number of added monogastric samples are shown in Figure 1, and the performances of the final calibrations are shown in Figure 2.

Figure 1. RMSEP of the ruminant and monogastric validation samples during the calibration update procedure. Note that the RMSEP for monogastric feed drops when the calibrations are updated with monogastric samples. Also note that the accuracy for ruminant feed is almost constant for LS-SVM and HR as the calibrations evolve whereas the RMSEP of the PLS increase.

Figure 2. Scatter plots of the observed vs predicted protein ‘as is’ levels for ruminant feed (top) and monogastric feed (bottom) using the final PLS (left), LS-SVM (middle), and HR (right) calibrations. The samples with yellow marks were identified as possible outliers. Note that the accuracies are systematically better for LS-SVM and HR than for PLS.
Discussion
This study showed that compared to regular PLS the accuracies of LS-SVM and HR are significantly improved. The data also indicated that the LS-SVM and HR calibrations adapt better to new applications than PLS. In fact, the LS-SVM and the HR accuracies for ruminant feed are consistent, but the PLS accuracy declines as more monogastric data are added. This occurs because of the nature of the problem. PLS is based on a linear regression model. Monogastric and ruminant feed are really quite different from each other. The best line fit is going to be a compromise between the best fit of the monogastric and the best fit of the ruminant data when using PLS. The other two techniques are non-linear methods. They each have a way of grouping the samples so that the best fit for the monogastric data does not interfere with the best fit line for the ruminant data. With LS-SVM and HR the calibration line can be bent to fit both groups. The LS-SVM and HR predictions depend on the distance between the calibration and the validation samples. The monogastric and ruminant samples are not entirely overlapping, and therefore the predictions of the ruminant validation samples are not significantly affected by the extra monogastric samples.
The HR adapts without recalculating the calibration, which is not the case for PLS or LS-SVM. The HR calibration update procedure is therefore more straightforward than for PLS and LS-SVM. As long as the spectra are representative and the laboratory assessments are accurate, the users can easily update their HR calibrations themselves by adding new samples to the library.
