Food Viscosity Testing Above the Boiling Point
Many modern food processing techniques and new, alternative ingredients (i.e. plant proteins, resistant starch) require temperatures at or above 100° C, but few rheological devices offer analysis of ingredient and food viscosity at that temperature.
Modern food processing techniques such as pasteurization and sterilization require high temperatures beyond the boiling point of water. Understanding how a food product will behave above 100° C matters when determining best methods and conditions to use in manufacturing.
The Rapid Visco Analyser (RVA) 4800 lets you test food samples in temperatures up to 140° C, and allows researchers, formulators, and manufacturers to better mimic high temperature conditions with the advantage of operating at a small scale.
Researchers can expand their study on difficult-to-cook resistant starch and plant proteins. Food manufacturers can make better informed decisions when optimizing formulation based on ingredient and food viscosity measurements. Ingredient manufacturers can support their claims of process resistance and further expand their product range.
RVA 4800 users can customize profile analyses to show variable shear rates, staggered temperature curves, or extended cook or cool holds. The custom profile in Figure 1, called shear loops, shows the effect of high temperatures and varying shear rates on the viscosity of the sample. Figure 1 shows three separate profiles with maximum temperatures of 95° C (to represent the standard profile), 121° C (to represent the ‘botulinum’ cook used in retorting), and 140° C (to represent the maximum temperature of the RVA). During the hot and cool hold periods, the stirring speed is varied to obtain more information on the Newtonian (or non-Newtonian) fluid behavior of various samples.
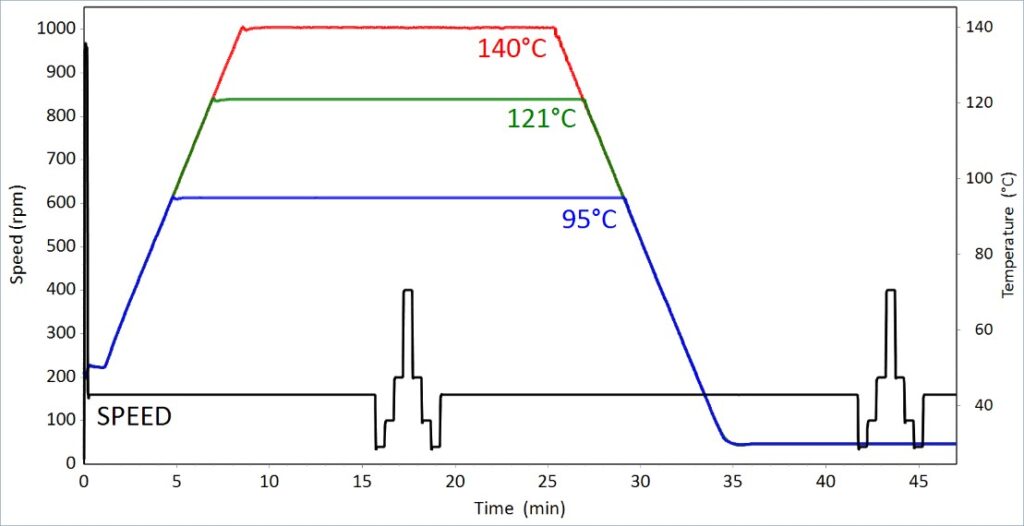
Figure 1. RVA test conditions – shear loops profile
Here are some examples of how you could use the RVA 4800 to optimize your food processing techniques:
Thermal Resistance and Viscosity Recovery
The thermal resistance of an ingredient, or its ability to resist viscosity loss during heating at temperatures above 100° C, can be determined using the ingredient’s thermal resistance. This way, manufacturers can confidently choose ingredients that can better retain functionality during the most extreme phases of food processes.
The ability of an ingredient to recover its viscosity during cooling can be compared in the RVA 4800 against the previous standard of the 95° C analysis. The cooling viscosity can be translated as the product viscosity or relative texture of the food after cooling, during storage, or prior to consumption.
Figure 2 shows a high process tolerant resistant starch under the shear loops pasting profile at 95, 121, and 140° C. This starch exhibited excellent thermal resistance (with little to no breakdown in viscosity at the hot stage), and good viscosity recovery (ability to recover viscosity following extended period at high temperatures) across all maximum cooking temperatures. This starch could be confidently used in processing temperatures of up to 140° C with minimal degradation, functional or rheological change (food viscosity).
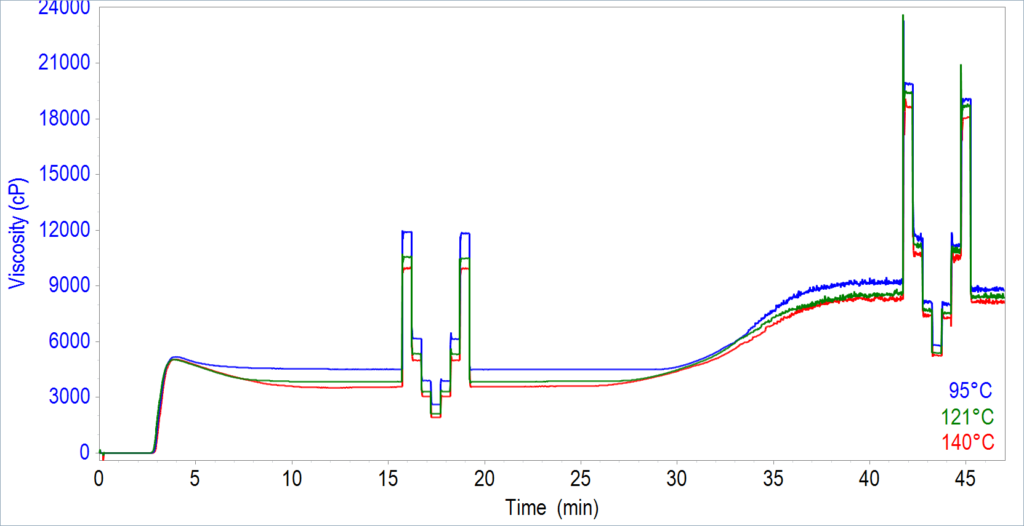
Figure 2. RVA curves of a high process tolerant starch, tested with “shear loops” at 95, 121, and 140° C.
Hydrocolloids and Gums
In addition to alternative ingredients, gelling agents and thickeners can also be analyzed for subsequent use in formulation. The hydrocolloid in Figure 3 was able to resist major degradation at 121° C but not at 140° C. Further investigation by changing the maximum temperature of the profile can show which temperature will cause the ingredient to lose most of its functionality. In food processes, this information would be useful when balancing temperature-time efficiency calculations that affect food viscosity.
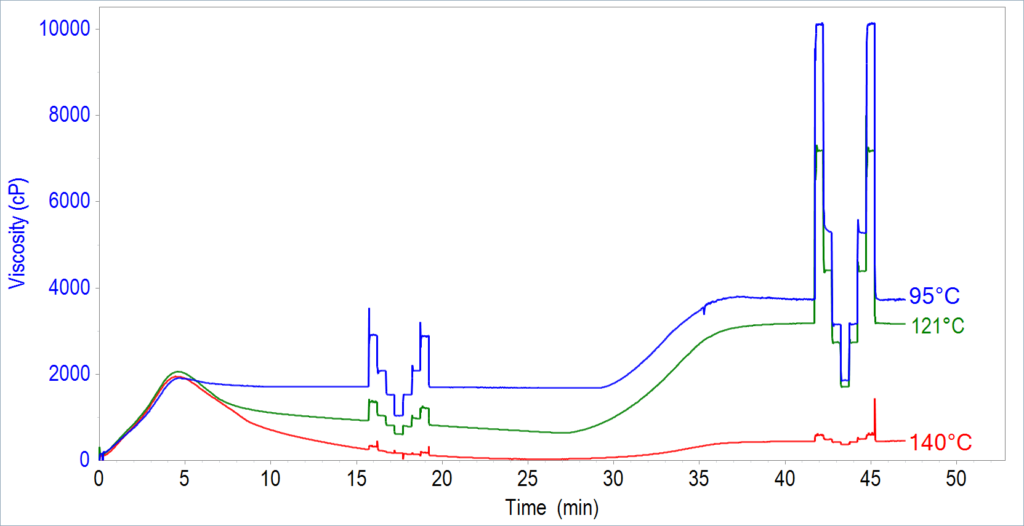
Figure 3. RVA curves of a hydrocolloid, tested with shear loops at 95, 121, and 140° C
Structural variants of the same hydrocolloid can also be discriminated at temperatures up to 140° C. Figure 4 shows three variants of one hydrocolloid analyzed with the shear loops profile at 140° C. The RVA curves show that this hydrocolloid has a general behavior of low hot viscosity with high cooling viscosity.
An ingredient with this behavior is particularly useful for increasing heating efficiency or reducing back pressure issues in processing systems but must still be able to contribute texture by gelling or thickening when cooled. Choosing the wrong variant may cause disastrous effects on the quality and consistency of the final product.
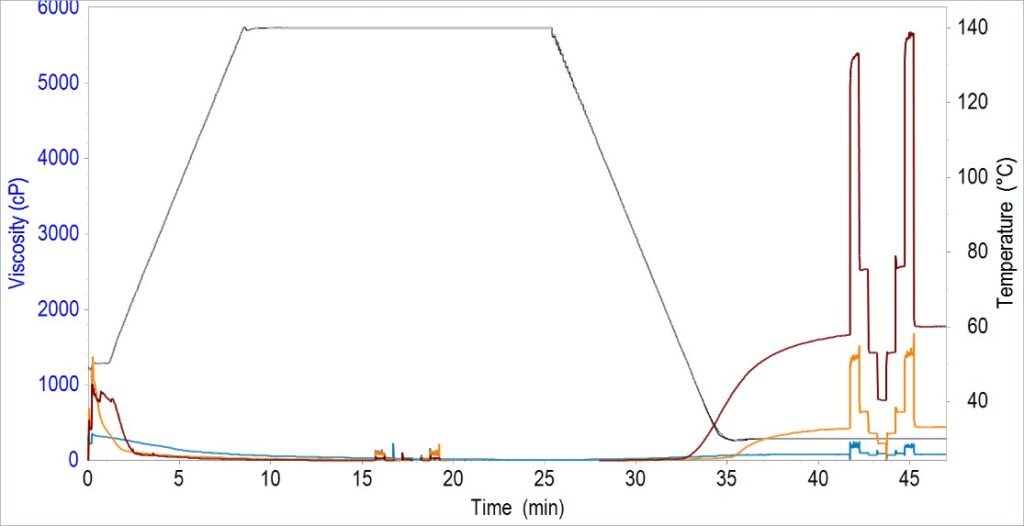
Figure 4. RVA curves of three variants of a hydrocolloid, tested with shear loops at 140° C.
Starches
The high temperature capability of the RVA 4800 allows the assessment of the pasting behavior of resistant starches (i.e., high-amylose starches) shown in Figure 5. Difficult-to-cook, resistant starches require high temperatures in order to sufficiently gelatinize, cook, or paste. For the high-amylose starch in Figure 5, 140° C was the most effective temperature to cause significant changes in the granules (i.e., gelatinization and retrogradation).
This valuable information can help determine which process temperature must be used to access the functional properties of high-resistant starches (i.e., enhancing crispiness). The RVA 4800 could be used as a tool to predict how well the starch can resist extreme conditions (i.e., digestion).
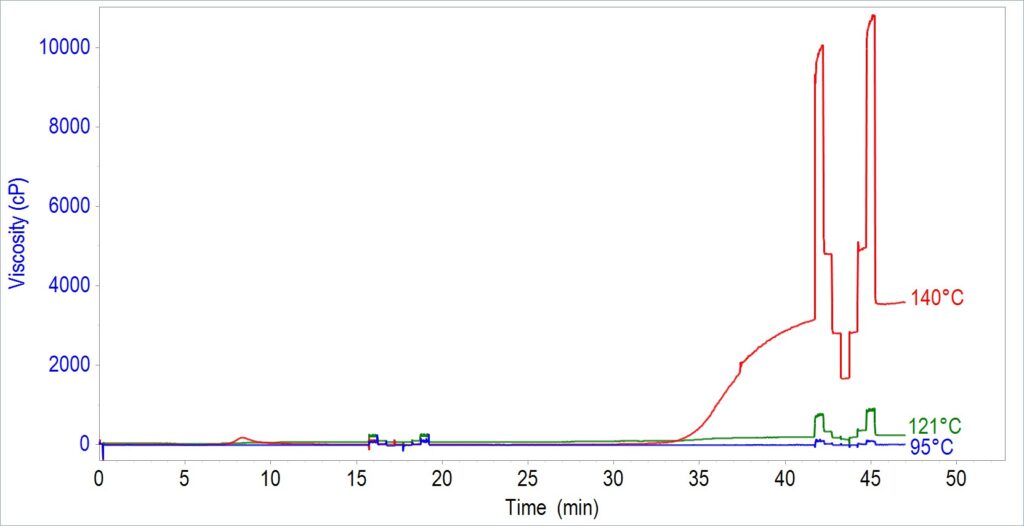
Figure 5. RVA curves of a high-amylose starch, tested with shear loops at 95, 121, and 140° C.
The RVA 4800 can distinguish starches with varying degrees of modification. Three degrees (low, medium, and high) of starch modification were analyzed with the “shear loops” profile at 140° C. From the RVA curves shown in Figure 6, the starch with low modification exhibited poor thermal resistance due to its low overall viscosity.
On the other hand, the highly modified starch showed minimal thermal degradation and a significant viscosity recovery. The highly modified starch would be the most stable and the ideal starch to use in high temperature processing conditions. These RVA curves (Figure 6) demonstrate the magnitude and effect of increasing the degree of modification on the thermal and process resistance of starches.
The RVA 4800 can also be used to help determine which type of modification is most suited to a specific process.
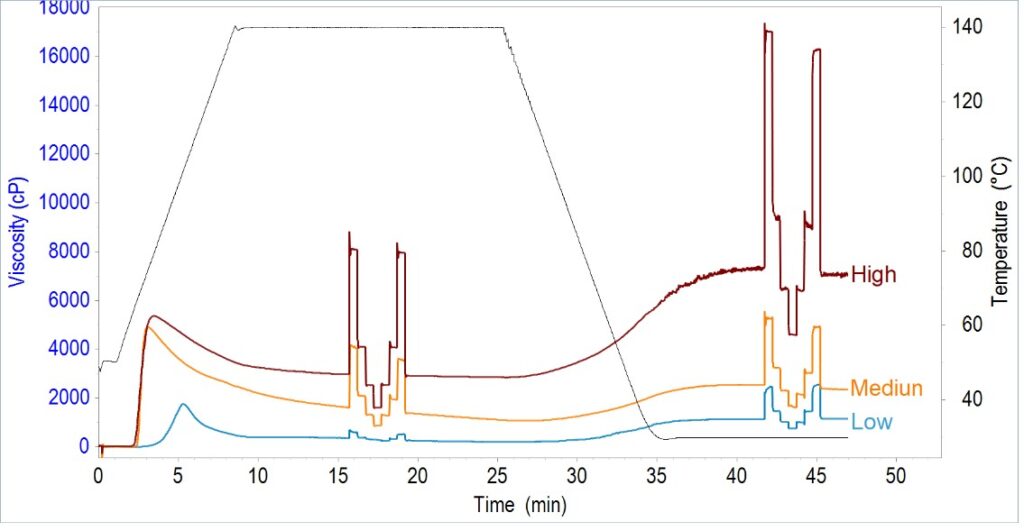
Figure 6. RVA curves of a starch with varying degrees of modification, tested with shear loops at 140° C.
Effect of Batch Variation
Several factors (such as biological origin and process/manufacture/preparation conditions) can drastically affect the rheological behavior of a hydrocolloid and its process suitability. Figure 7 shows the importance and power of the RVA 4800 in differentiating between batches of the same hydrocolloid. The RVA 4800 is a handy tool in assuring quality of ingredients prior to homogenizing batch formulations, and thereby crucial in reducing costs and maintaining process efficiency.
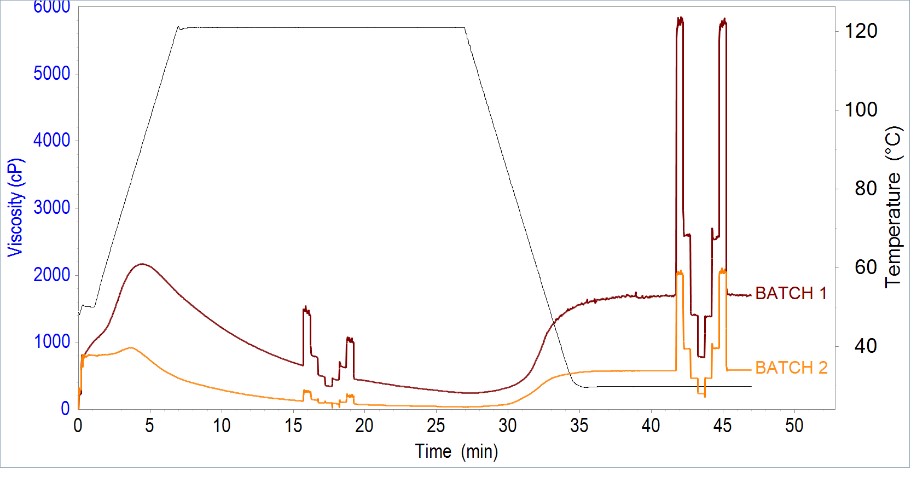
Figure 7. RVA curves of two different batches of the same hydrocolloid, tested with shear loops at 121° C.
Read more about the RVA 4800